Do you know who your top customers are? Or which ones regularly overuse their support or service contracts? What about which products are the most popular? With data scattered throughout your business, it can be extremely difficult to join the dots up to make strategic decisions on which areas are growing and which ones need some attention. Sound familiar? You need a business intelligence tool and we recommend Power BI.
Data Preparation
Data is a key asset for any business but it is often flawed with inconsistencies, inaccuracies and duplications – making it a nightmare when it comes to sending customer communications or making strategic decisions.
Our solutions, therefore, usually involve creating a data warehouse which acts as the “brain” of the solution. It can bring together data from many separate software applications and resides on your server (on premise or within our private hosted cloud). We use a SQL database, but other databases can be used if you do not have a SQL server.
We use SQL tools for extracting the raw data from your databases e.g. accounts, CRM etc. For Power BI reporting, the data is generally extracted daily but may be more frequent, especially if the data warehouse is used for other tasks e.g. updating a customer portal.
Within the data warehouse, we structure the data to perform various tasks, such as joining the multiple data sources together, standardising data formats and appending other data values that do not exist in the original data sources. We then use SQL to prepare the data, creating data cubes that can be consumed by the Microsoft Power BI application.
The Microsoft Power BI Gateway is used to send the data cubes to the Microsoft platform. Either we, or you, can then access the data to create Workspaces, which are customised dashboards for viewing and analysing data. Typically, we create the initial workspaces, then our customers learn how to update the workspaces themselves. Workspaces can be shared between multiple staff.
What does a Power BI workspace look like?
Workspace Example #1
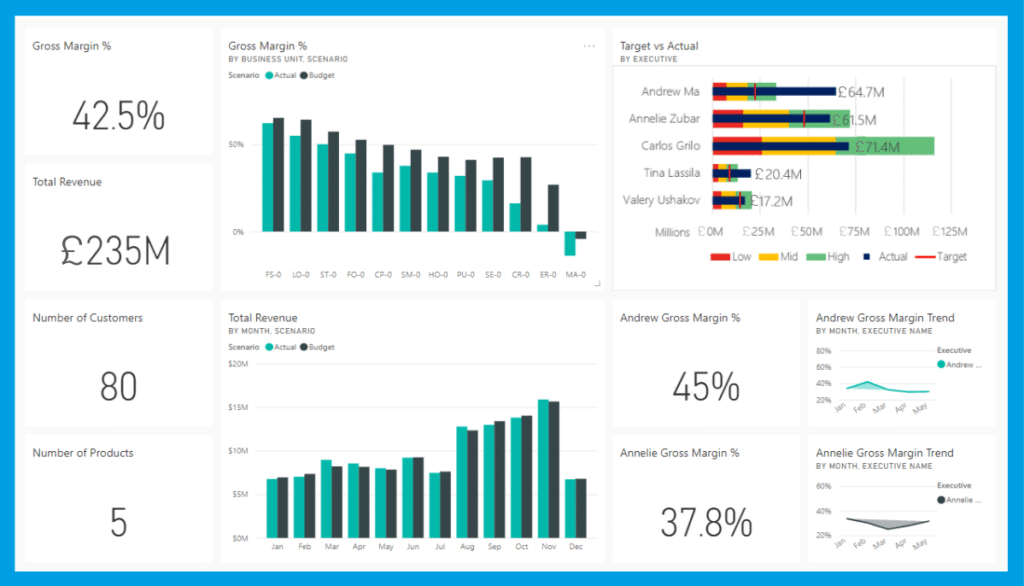
The workspace below consists of visuals (widgets) from multiple reports. You can choose which key indicators it shows. Clicking on any visual will take you to the full report.
Workspace Example #2
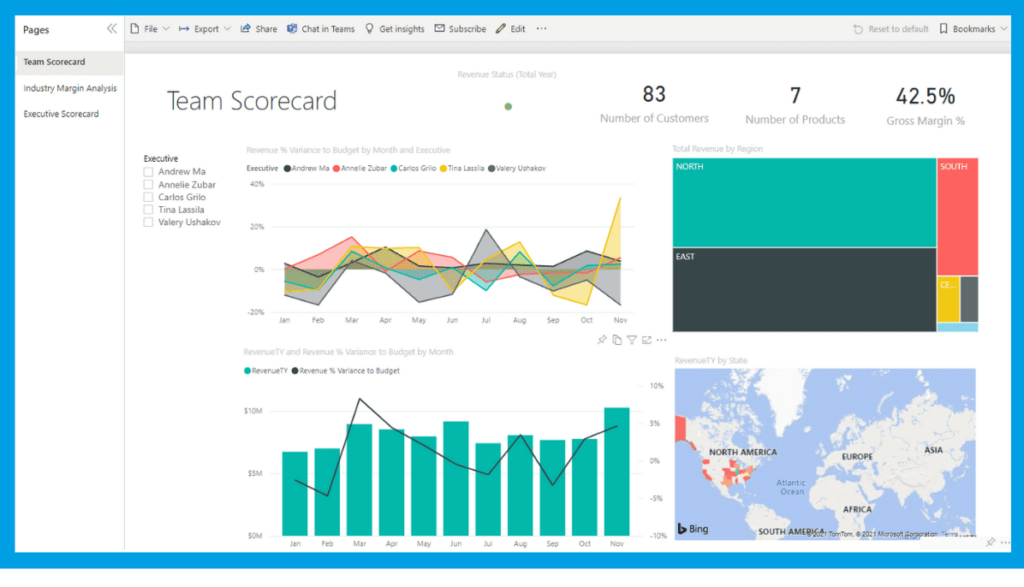
The next example is a Dashboard displaying a Sales Teams revenue compared to budget plus a map plotting where their Customers are based. It has a filter for “Executive” that filters the widgets and drills down into the data. Similarly, data can be filtered by clicking on a section of a widget as opposed to a filter for example clicking on the North Region.
Workspace Example #3
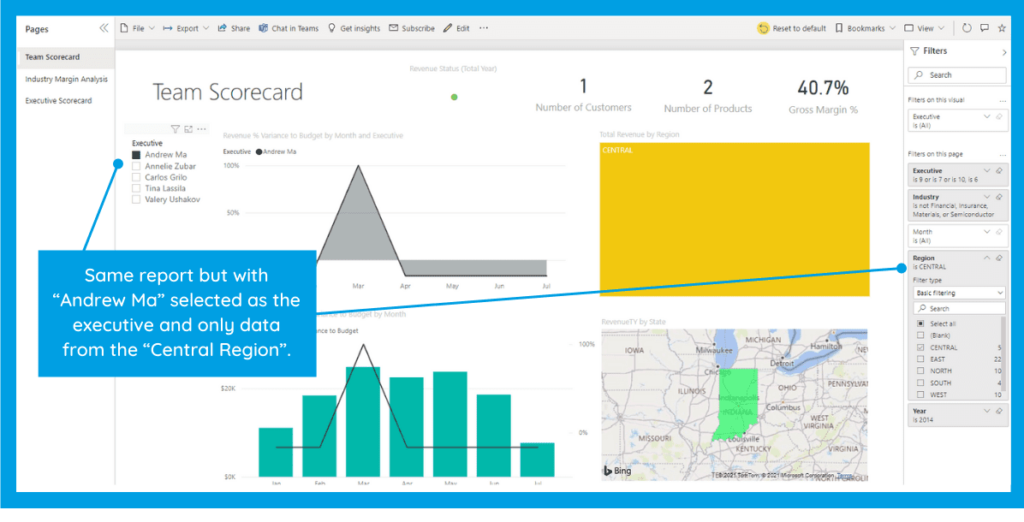
Drill into your Dashboards by selecting a specific Team Member and analyse their revenue compared to budget in their specific region. Selecting Andrew Ma from the list of Executives and the Central Region in workspace example #2 shows the subset of filtered data.
You can export data from a specific visual or view the raw data in a table.
What Our Customers Say
I’m using Power BI a lot more now than I did when we started with creating refreshable dashboards for SLT and other management levels showing different elements of the business. We are doing this by implementing the data warehouse built by Avrion, which is very handy. I love Power BI and think it is such a great tool that every business can have/use as it turns your raw data into a story that shows different aspects from the company over time.” – Dan Costin, Commercial Analyst at Restore Datashred
Other uses for Data Warehouse Information 
Whilst a Data Warehouse is primarily designed to deliver data for Microsoft Power BI consumption, it can also be expanded to do much more. For example, the data warehouse could be used:
- For automating processes as part of your digital transformation journey
- As a centralised reporting suite for managers to access and run reports (including sending alert-orientated reports to management based on data events)
- For updating a customer portal, enabling customers to view order history online. Data can also be extracted from a portal and fed into an operating system e.g. a customer quote request or a customer online order, which then creates a customer Opportunity in the CRM system
- For creating campaign lists based on customer behaviour and passing this to an email automation tool such as Mailchimp or dotdigital in order to add the customer to a targeted email campaign.
What Next?
Once you’ve got the data visualisation, you can send reports automatically using Power Automate.
Power BI is really easy to attain and implement and has so many useful purposes. To learn more, read our blog about why Business Intelligence is a great thing to have. You’ll be amazed at what you can achieve!
If you have any questions or would like to discuss Power BI, get in touch.


